Fosstodon and Twitter

2024

Why Anthropic?

Tldr

Below is my written statement for applying a PM role at Anthropic.

All companies are talking about Safety, Responsible AI. But I rarely see a company like Anthropic saying they want AI be helpful, honest and harmless, these wording makes me feel like at Anthropic,

we are treating AI is like raising a kid, those are the fundamental traits all parents and the society want the kids to be and aim for.

I think this conveys a different position how Anthropic treat AI, not as a technology will replace human being to boost productivity etc, but grow the AI like a potential partner, another human being, by nature, the current LLM is reflecting what the world is, what human being are, and being helpful, being honest and being harmless is a very humble attitude!which was, is and will be traits I pursue as a mere human being as well.

So, by working at Anthropic, I’m anticipate I could continue pursuing these traits with people sharing the same value and a new partner AI, one day it could be sentient! and I believe that.

中国真正的AI竞争优势

Go Read Original Version in English here

中國在 AI 競爭中的唯一真正優勢?

China's True and ONLY AI Competitive Advantage

TL;DR

中國真正的 AI 競爭優勢在於其成熟且相對便宜的核能發電容量和建設能力。這一優勢使中國能夠通過能源貿易,獲取無法跟上 AI 能源需求的國家的先進 GPU 和 AI 計算資源。這或許是中國在 AI 競爭中保持相關性的唯一機會。

在人工智慧的世界中,數據和計算能力是推動創新的雙引擎。儘管大部分的對話都圍繞著算法、模型和硬件進行,但有一個被忽視的隱藏力量——能源。像 OpenAI 的 GPT-4 這樣的 AI 模型需要大量的能源來進行訓練,而中國真正的競爭優勢或許不在於硅,而是在於某種更基本的東西:發電能力

AI 背後的能量

要了解能量的重要性,讓我們來看看一些數據。例如,訓練一個像 GPT-4 這樣的大型語言模型需要驚人的 51,773 兆瓦時(MWh)[^1]的能源——足以為一個美國家庭供電超過 5000 年。換句話說,這相當於讓 10,000 台 Nvidia Tesla V100 GPU 在 150 天內全速運行。

GPT-4 Energy Consumption

對於依賴先進 AI 開發的國家來說,能源帳單可能是天文數字的。而這正是中國被低估的優勢所在:其 核能發電能力

中國的核能優勢:一個被忽視的資產

截至 2024 年年中,中國擁有 56 座運營中的核反應堆,總裝機容量達到 58,218 MWe。僅在 2024 年上半年,這些反應堆就產生了令人印象深刻的 212,261,000 MWh 的電力。相比之下,訓練 GPT-4 所需的能量只佔中國在六個月內總核電輸出的 0.02%

但這還不是全部。中國已經批准了 11 座新的核反應堆,每座核反應堆的容量為 1,000 MWe,這將每年新增 85,628,220 MWh 的能源。簡而言之,中國即將能夠輕鬆地每年為多個 GPT-4 類模型的訓練提供電力——毫不費力

為什麼能源比以往更加重要

在 AI 競賽中,計算能力(用 FLOP/s 表示,即每秒浮點運算次數)是所有人關注的焦點。但這裡有個關鍵點:要將 FLOP/s 轉化為具體的 AI 能力,你需要大量的能源。

擁有豐富計算能力但缺乏能源的國家將面臨瓶頸。與此同時,中國仍在應對高端半導體技術的限制,但它擁有未被開發的能源儲備,這可能會重新定義其 AI 策略。儘管美國在晶片領域佔據主導地位,但中國正悄然成為 AI 能源超級大國

GPU-能源困境

Nvidia 的 Tesla V100 是 AI 領域的領先 GPU 之一,每台消耗約 300W 的電力。當規模擴展到像 GPT-4 訓練這樣的級別時,能源需求成為一個重要因素。對於運行大規模 GPU 集群的國家來說,能源費用很快就會失控。這給中國帶來了一個獨特的機遇。

儘管美國在 計算能力 方面佔據領先地位,但許多國家在 能源 方面面臨著嚴重的短缺。而這正是中國的 核反應堆 能夠發揮作用的地方。想像一下,中國利用其充足且便宜的核能,能夠將能源作為籌碼,換取無法跟上 AI 能源需求的國家的先進 GPU 和 AI 計算資源。

一種新策略出現了:通過將核能發電能力作為談判籌碼,中國可以將自己定位為 AI 驅動經濟體的不可或缺的能源供應者。與其在晶片生產上競爭,中國可以提供燃料——能源——來為全球的 AI 提供動力。

一種新的 AI 貨幣:能源

在美國的制裁使中國越來越難以獲得最先進的晶片和 GPU 的時代,中國可以通過將 能源作為貨幣 來扭轉局勢。與其依賴國內的晶片生產(目前受制於來自 ASML 的 EUV 光刻機的缺乏),中國可以與那些擁有高端計算資源但缺乏電力基礎設施的國家進行交易,將能源作為交換籌碼。

通過使用能源來換取計算資源,中國可以在不直接與美國競爭半導體製造的情況下,繼續在 AI 競爭中占據一席之地。這一策略不僅有助於中國規避制裁,還創造了一種新的經濟範式,在這種範式中,能源——而不僅僅是晶片——成為了 AI 世界中的關鍵貨幣

AI 競爭不僅僅關於晶片

展望未來,很明顯,AI 競爭將不僅僅由硅片決定。能源的可用性和消耗將成為擴展 AI 能力的決定性因素。憑藉其無與倫比的核能發電能力,中國可能不需要最先進的晶片就能在 AI 競賽中保持相關性——它只需要為世界上能源需求最大的 AI 模型提供動力

中美核能發電建設能力對比[^2]

國家/地區 核電廠型號 建設開始時間 預計並網時間 成本 (USD/kW) 建設週期 (年)
美國 AP1000 (Vogtle Units 3 & 4) 2013 2023 >12000 10
美國 AP1000 (後續項目) -- -- 8000 (批量生產時 5000) --
芬蘭 EPR (Olkiluoto Unit 3) 2005 2022 6750 17
法國 EPR (Flamanville Unit 3) 2007 2023 7700 16
英國 EPR (Hinkley Point C Units 1 & 2) 2018/2019 2027/2028 11100 10
印度 VVER-1200 (Kudankulam Units 3-6) 2017/2021 2023/2027 5200 6
中國 AP1000 (首座機組) -- -- 美國成本的1/4 ~ 2500 --
中國 AP1000 (批量生產) -- -- 美國成本的1/2.5~1/3 ~ 3000 至 4000 --

如果中國能夠批量建設 AP1000 反應堆,成本將為美國的 1/2.5 ~ 1/3,時間將為美國的 1/3,約 3000 ~ 4000 美元/kW。

如果中國建造一個專門用於訓練 GPT-4 模型的核反應堆?

GPT-4 的訓練時間約為五到六個月。因此,10,000 台Nvidia V100 全速運行 150 天,能耗約為 7200000000 瓦時,或者 7,200 MWh[^3]。

中國新核反應堆的平均容量為 1,000 MWe。假設運行的容量因數為 88.85%,這座反應堆全年運行的情況下將產生:

\[ \text{年發電量} = 1,000 \, \text{MWe} \times 88.85\% \times 24 \times 365 \]
\[ \text{年發電量} = 1,000 \times 0.8885 \times 8,760 \, \text{小時} = 7,780,860 \, \text{MWh/年} \]

因此,一座新的反應堆每年可產生 7,780,860 MWh

2. 訓練一個 GPT-4 模型所需的能源

訓練一個 GPT-4 模型所需的能量為 51,773 MWh

3. 計算一座核反應堆每年可以訓練多少 GPT-4 模型

現在,我們來計算一座核反應堆每年可以訓練多少個 GPT-4 模型:

\[ \text{GPT-4 模型數量} = \frac{7,780,860 \, \text{MWh/年}}{51,773 \, \text{MWh/GPT-4 模型}} \]
\[ \text{GPT-4 模型數量} = 150.24 \]

即,一座新的核反應堆每年可以訓練 150 個 GPT-4 模型

洞察🔥

目前 GPT-4 的訓練成本大約為 6300 萬美元[^6],假設中國的核能發電價格是美國的 1/3,那麼訓練成本將降至 2100 萬美元

結論

現在,美國的制裁限制了中國獲取 7nm 以下晶片,切斷了來自 ASML 的先進 EUV 光刻機,同時禁止 Nvidia 向中國出售頂級 GPU。中國最好的策略可能是專注於自己可以快速且廉價完成的事情——建造核反應堆。通過使用“能源/電力”作為信用體系,中國可以利用其豐富的能源來換取 GPU 和計算資源,這些國家雖然擁有技術,但難以滿足 AI 訓練的巨大能源需求。這一戰略轉變可以使中國在 AI 競爭中保持競爭力,儘管它面臨美國主導的西方集團的限制。

img

潛在的能源交易夥伴國家

中東、南亞/東盟非洲領先國家,等等。因為北約國家、澳大利亞、新西蘭、日本、韓國甚至台灣已經或即將進入美國主導的陣營。可交易的國家不多了,時間也不多了。

China's True and ONLY AI Competitive Advantage

China's TRUE AND ONLY AI Competitive Advantage?

China's True and ONLY AI Competitive Advantage

TL;DR

China's true AI competitive advantage lies in its mature commericalized and relatively inexpensive nuclear power capacity and building capacity. This advantage allows China to trade energy for access to advanced GPUs and AI compute resources from countries that can't keep pace with the power demands of AI. This maybe is the only chance China could still be relevant in the AI race.

In the world of artificial intelligence, data and computational power are the twin engines driving innovation. While most of the conversation revolves around algorithms, models, and hardware, there's a hidden force that often gets overlooked—energy. AI models like OpenAI's GPT-4 require massive amounts of energy for training, and it turns out that China's real competitive edge might lie not in silicon, but in something much more elemental: power generation.

The Power Behind AI

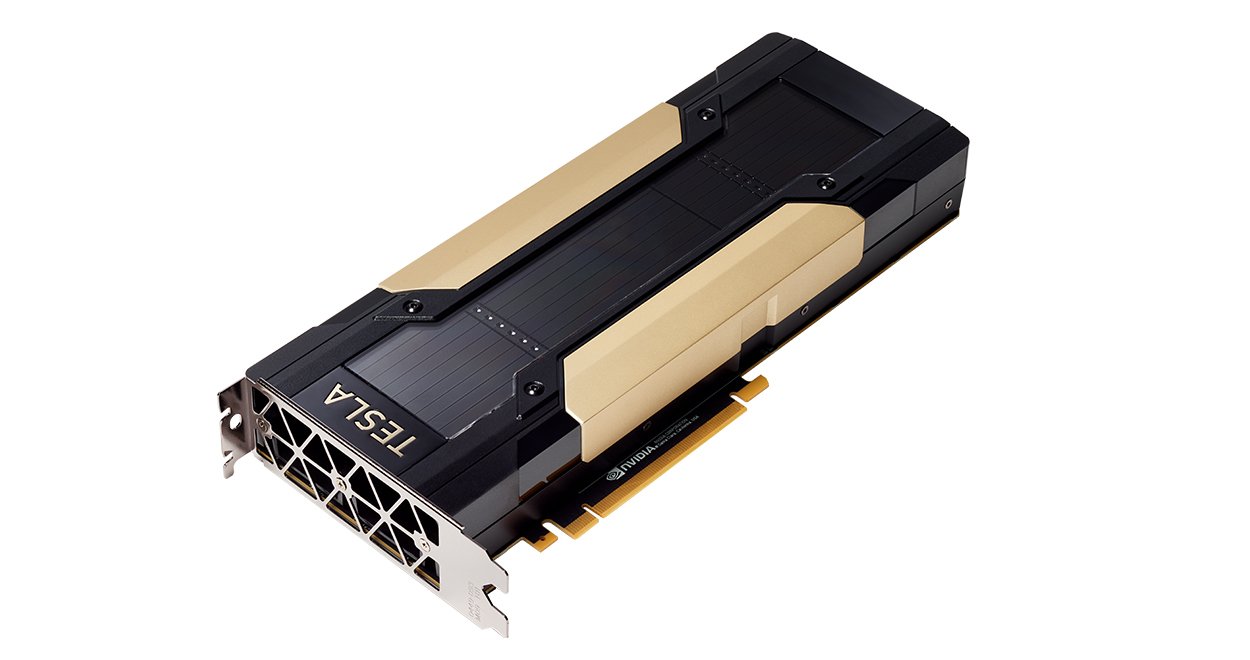
To grasp how crucial energy is, let's dive into some figures. Training a large language model like GPT-4, for example, requires an astounding 51,773 megawatt-hours (MWh)1 of energy—enough to power an average U.S. household for over 5,000 years. In traditional terms, this translates into running 10,000 Nvidia Tesla V100 GPUs at full throttle for 150 days straight.
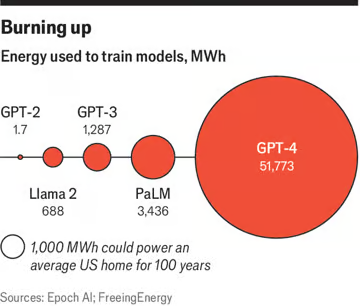
GPT-4 Energy Consumption

For nations that rely heavily on advanced AI development, the energy bill can be astronomical. This is where China’s underappreciated advantage comes into play: its nuclear energy capacity.

China’s Nuclear Capacity: An Overlooked Asset

As of mid-2024, China boasts 56 operational nuclear reactors with a total installed capacity of 58,218 MWe. In just the first half of 2024, these reactors generated an impressive 212,261,000 MWh of electricity. For comparison, the energy required to train GPT-4 is a mere drop in this ocean, accounting for just 0.02% of China’s total nuclear output in six months.

But that’s not all. China has approved the construction of 11 more reactors, each with a 1,000 MWe capacity, which will add another 85,628,220 MWh of energy annually. In short, China is on track to comfortably power the training of multiple GPT-4-like models each year—without breaking a sweat.

Why Energy Matters More Than Ever

In the AI race, computational power—measured in FLOP/s (Floating Point Operations per Second)—is the metric everyone obsesses over. But here's the kicker: to convert FLOP/s into tangible AI capabilities, you need energy. A lot of it.

Countries with abundant computational power but insufficient energy face a bottleneck. Meanwhile, China, which is still grappling with restrictions on high-end semiconductor technology, has an untapped reservoir of energy that could redefine its AI strategy. While the U.S. dominates on the chip side of things, China is quietly becoming an AI energy superpower.

The GPU-Energy Dilemma

Nvidia’s Tesla V100, one of the leading GPUs for AI, consumes about 300W of power. When scaled to the levels needed for training models like GPT-4, the energy requirement becomes a significant factor. For countries running massive GPU clusters, the power bill can quickly spiral out of control. This presents a unique opportunity for China.

While the U.S. may lead in computational horsepower, many countries face a crucial shortfall in energy. And that’s where China’s nuclear reactors come into play. Imagine a scenario where China, leveraging its abundant and inexpensive nuclear power, could trade energy credits for access to advanced GPUs and AI compute resources from countries that can’t keep pace with the power demands of AI.

A new strategy emerges: by using its nuclear power capacity as a bargaining chip, China could position itself as an indispensable energy supplier to AI-driven economies. Instead of competing in chip production, China could provide the fuel—energy—to power AI around the world.

A New Kind of AI Currency: Energy

In an era where the U.S. sanctions are making it increasingly difficult for China to access cutting-edge chips and GPUs, China could turn the tables by treating energy as currency. Instead of relying on domestic chip production (which is currently hampered by a lack of EUV lithography machines from ASML), China could strike deals with countries that have access to high-end computing resources but lack the power infrastructure to keep them running efficiently.

By using energy to barter for compute resources, China could remain a major player in the AI race without needing to directly compete with the U.S. in semiconductor manufacturing. This strategy not only helps China bypass the sanctions but also creates a new economic paradigm where energy—not just chips—becomes a key currency in the AI world.

The AI Race Isn’t Just About Chips

As we look to the future, it’s clear that the AI competition will be shaped by more than just silicon. Energy availability and consumption will be the defining factors in scaling up AI capabilities. With its unmatched nuclear power capacity, China might not need the most advanced chips to stay relevant in the AI game—it just needs to power the world’s most energy-hungry AI models.

China's Nuclear Reactors Building Capacity vs US2

Country/Region Nuclear Power Plant Model Construction Start Expected Grid Connection Cost (USD/kW) Construction Period (years)
USA AP1000 (Vogtle Units 3 & 4) 2013 2023 >12000 10
USA AP1000 (Subsequent Projects) -- -- 8000 (5000 in batch) --
Finland EPR (Olkiluoto Unit 3) 2005 2022 6750 17
France EPR (Flamanville Unit 3) 2007 2023 7700 16
UK EPR (Hinkley Point C Units 1 & 2) 2018/2019 2027/2028 11100 10
India VVER-1200 (Kudankulam Units 3-6) 2017/2021 2023/2027 5200 6
China AP1000 (First Unit) -- -- 1/4 of US cost ~ 2500 --
China AP1000 (Batch Production) -- -- 1/2.5-1/3 of US cost ~ 4000 to 3000 --

If China could build AP1000 reactors in a batch, the cost would be 1/2.5 ~ 1/3 of the US, and the time would be 1/3 of the US, roughly around 3000 ~ 4000 USD/kW.

What if China Builds a Nuclear Reactor dedicated to training GPT-4 Model?

The training time of GPT-4 is around five to six months. So, 10,000 V100, running for 150 days on full power, means energy consumption of 7200000000 watt-hours, or 7,200 MWh.3

China's new reactor’s average capacity is 1,000 MWe. Assuming a capacity factor of 88.85%, the reactor operates at this level throughout the year.

\[\begin{align*} \text{Annual energy output} &= 1,000 \, \text{MWe} \times 88.85\% \times 24 \times 365 \\[10pt] \text{Annual energy output} &= 1,000 \times 0.8885 \times 8,760 \, \text{hours} = 7,780,860 \, \text{MWh/year} \end{align*}\]

So, one new reactor would generate 7,780,860 MWh per year.

  1. Energy Required to Train One GPT-4 Model

The energy required to train one GPT-4 model is 51,773 MWh.

  1. Calculate How Many GPT-4 Models Can Be Trained

Now, to calculate how many GPT-4 models could be trained with the annual energy output of one reactor:

\[\begin{align*} \text{Number of GPT-4 models} &= \frac{7,780,860 \, \text{MWh/year}}{51,773 \, \text{MWh/GPT-4 model}} \\[10pt] &= 150.24 \end{align*}\]

i.e. one reactor can train 150 GPT-4 models per year.

Insights🔥

And the current training cost of GPT-4 is around $63 million.6, let's say China's nuclear-generated power price is 1/3 of the US, then the cost would be $21 million.

Final Thoughts

Now, given U.S. sanctions blocking China's access to sub-7nm chips by cutting off advanced EUV machines from ASML and restricting Nvidia from selling top-tier GPUs, China’s best shot might be to focus on what it can do fast and cheaply—build nuclear reactors. Using "energy/power" as a credit system, China could trade its abundant energy for access to GPUs and computing resources from countries* that have the technology but are struggling with the massive energy consumption of AI training. This strategic pivot could keep China highly competitive in the AI race, even as it navigates the restrictions imposed by the U.S.-led Western bloc.
img

Countries could be potential trading partners

like Mid East, South Asia/ASEAN, Leading African countries, etc. Because NATO countries, Australia, New Zealand, Japan, South Korea and even Taiwan will and already are in the U.S. led camp. Not too many countries are left and not too much time left.

Forbes AI 50 2024 Companies

$34.7B in total funding since 2013

pie title Total Fundings by Country (Include USA)
"Australia": 31000000
"Canada": 529000000
"France": 592000000
"Germany": 100000000
"Netherlands": 101000000
"Sweden": 82000000
"United Kingdom": 258000000
"United States": 33009000000
pie title Total Fundings by Country (Exclude USA)
"Australia": 31000000
"Canada": 529000000
"France": 592000000
"Germany": 100000000
"Netherlands": 101000000
"Sweden": 82000000
"United Kingdom": 258000000

Paris 2024 Summer Olympics Medal Analysis

img
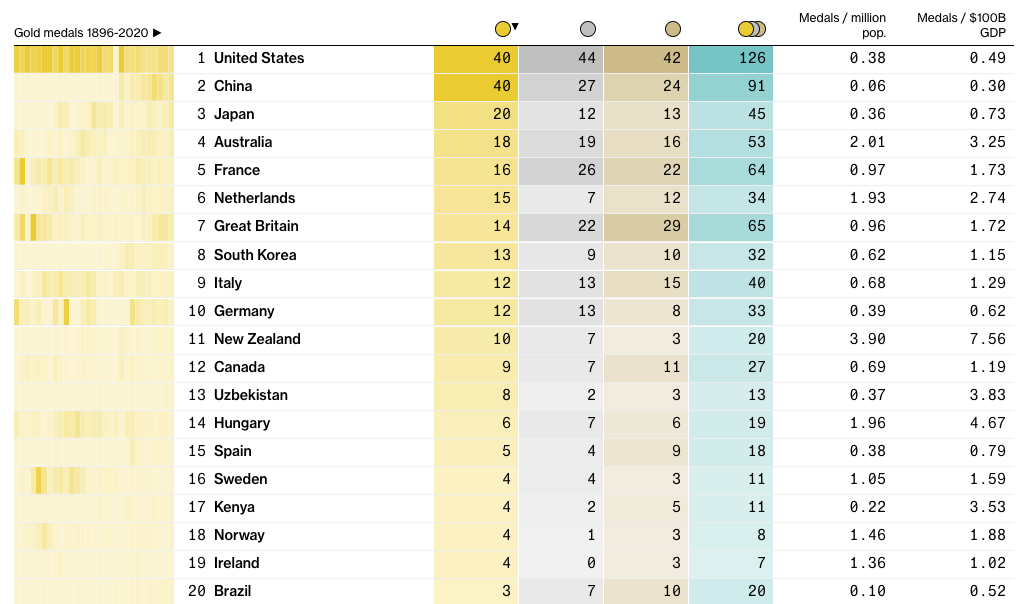
Medals by Team by Bloomberg

TL;DR

Tips

  • The United States🇺🇲 is overall the most "effective" or "ROI" country in the 2024 Paris Summer Olympics in terms of GDP per capita invested vs medals won.
  • Australia🇦🇺, the Netherlands🇳🇱, and Japan🇯🇵 are also among the top performers in terms of cost-effectiveness. Especially the Australia🇦🇺n, given its population size is almost equal to Texas, USA, it is a Olympic Superpower in terms of cost-effectiveness.
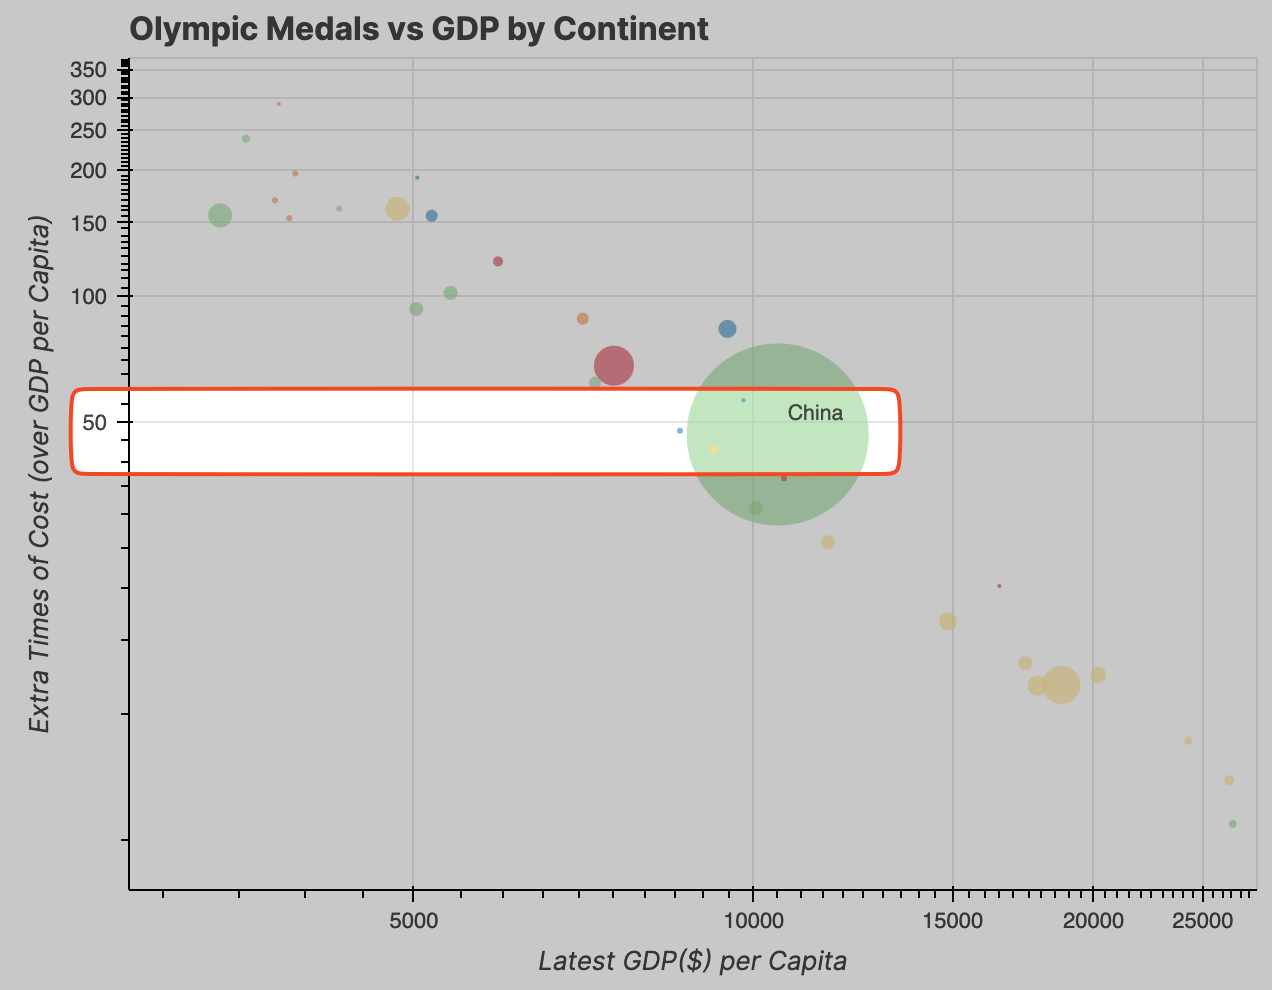
  • China🇨🇳, the medal won does not justify the GDP per capita invested in the Olympics, which shows an individual might need to invest 48 times more than the GDP per capita to win a medal in China🇨🇳.

Data Processing

Column Name Definition
rank_by_gold Ranking of countries based on the number of gold medals won
country Name of the country
gold Number of gold medals won by the country
silver Number of silver medals won by the country
bronze Number of bronze medals won by the country
total_medal Total number of medals (gold + silver + bronze) won by the country
medals_per_million_population Number of medals won per million population of the country
medals_per_usd_100b_gdp Number of medals won per 100 billion USD of the country's GDP
ratio__usd_100b_gdp_vs_million_population Ratio of medals per 100 billion USD GDP to medals per million population
medal_usd_gpd_population_cost Cost (in USD) associated with winning a medal, factoring in GDP and population
continent The continent to which the country belongs
latest_gdp_per_capita_usd The most recent GDP per capita of the country in USD
latest_year_gdp_per_capita_information The year for which the GDP per capita information is provided
source_gdp_info The source of the GDP information
medal_usd_gpd_population_cost_extra Additional cost (in USD) above the GDP per capita associated with winning a medal
medal_usd_gpd_population_cost_extra_percentage Additional cost as a percentage of GDP per capita associated with winning a medal
index rank_by_gold country gold silver bronze total_medal medals_per_million_population medals_per_usd_100b_gdp ratio__usd_100b_gdp_vs_million_population medal_usd_gpd_population_cost continent latest_gdp_per_capita_usd latest_year_gdp_per_capita_information source_gdp_info medal_usd_gpd_population_cost_extra medal_usd_gpd_population_cost_extra_percentage
0 1 United States 40 44 42 126 0.38 0.49 1.29 129000.0 North America 63543.58 2021 World Bank 65456.42 1.03
1 2 China 40 27 24 91 0.06 0.3 5.0 500000.0 Asia 10500.4 2020 IMF 489499.6 46.62
2 3 Japan 20 12 13 45 0.36 0.73 2.03 203000.0 Asia 40193.3 2021 World Bank 162806.7 4.05
3 4 Australia 18 19 16 53 2.01 3.25 1.62 162000.0 Oceania 51812.15 2021 World Bank 110187.85 2.13
4 5 France 16 26 22 64 0.97 1.73 1.78 178000.0 Europe 43658.98 2021 World Bank 134341.02 3.08

Plotting the Data

img
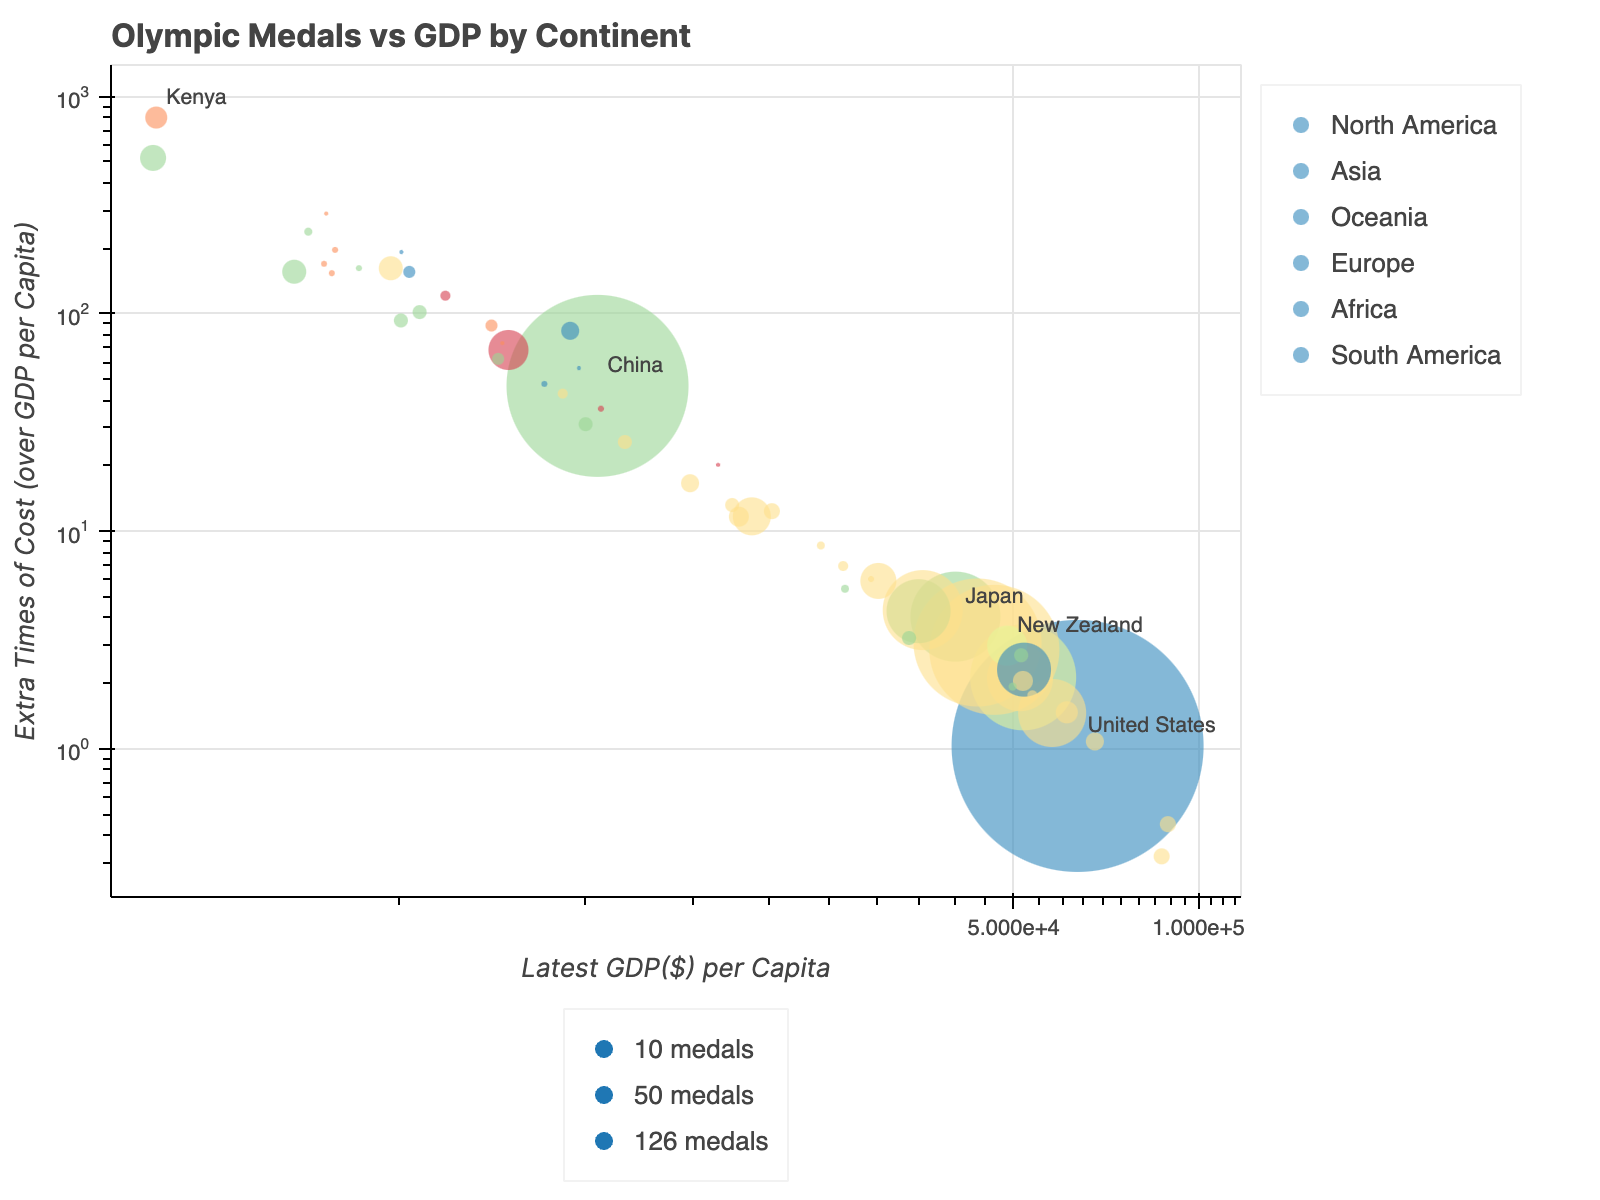
Bubble Size is the total Medals count

1. Overall Medal Distribution Among Countries

The distribution of Olympic medals among countries shows significant disparities:

  • Top performers: The United States🇺🇲 (126 medals), China🇨🇳 (91 medals), and Japan🇯🇵 (45 medals) lead in total medal count. These countries not only have large economies but also invest heavily in sports infrastructure.
  • Mid-range performers: Countries like Australia🇦🇺 (53 medals), France (64 medals), and Great Britain🇬🇧 (65 medals) perform well despite smaller populations, indicating efficient sports systems.
  • Emerging powers: Countries like the Netherlands🇳🇱 (34 medals) and New Zealand (20 medals) show strong performance relative to their population size. Concentration of medals: The top 10 countries account for approximately 60% of all medals, indicating a high concentration of Olympic success among a few nations.

There's a clear, but not perfect, correlation between GDP per capita and Olympic performance:

  • High GDP, high performance: Countries with high GDP per capita, such as the United States🇺🇲 ($63,544), Australia🇦🇺 ($51,812), and the Netherlands🇳🇱 ($57,768), tend to perform well in the Olympics.
  • Exceptions to the rule: Some countries with relatively lower GDP per capita, like China🇨🇳 ($10,500) and Japan🇯🇵 ($40,193), still perform exceptionally well, suggesting factors beyond economic power at play.
  • Diminishing returns: Very high GDP per capita doesn't guarantee proportionally higher medal counts. For example, Ireland ($94,556) and Norway ($89,154) have fewer medals than countries with lower GDP per capita.
  • Emerging economies: Some countries with lower GDP per capita, like Kenya ($2,007) and Ethiopia ($944), perform well in specific sports, showing specialization can overcome economic disadvantages.

3. Effectiveness Analysis: GDP per Capita vs Medal Costs

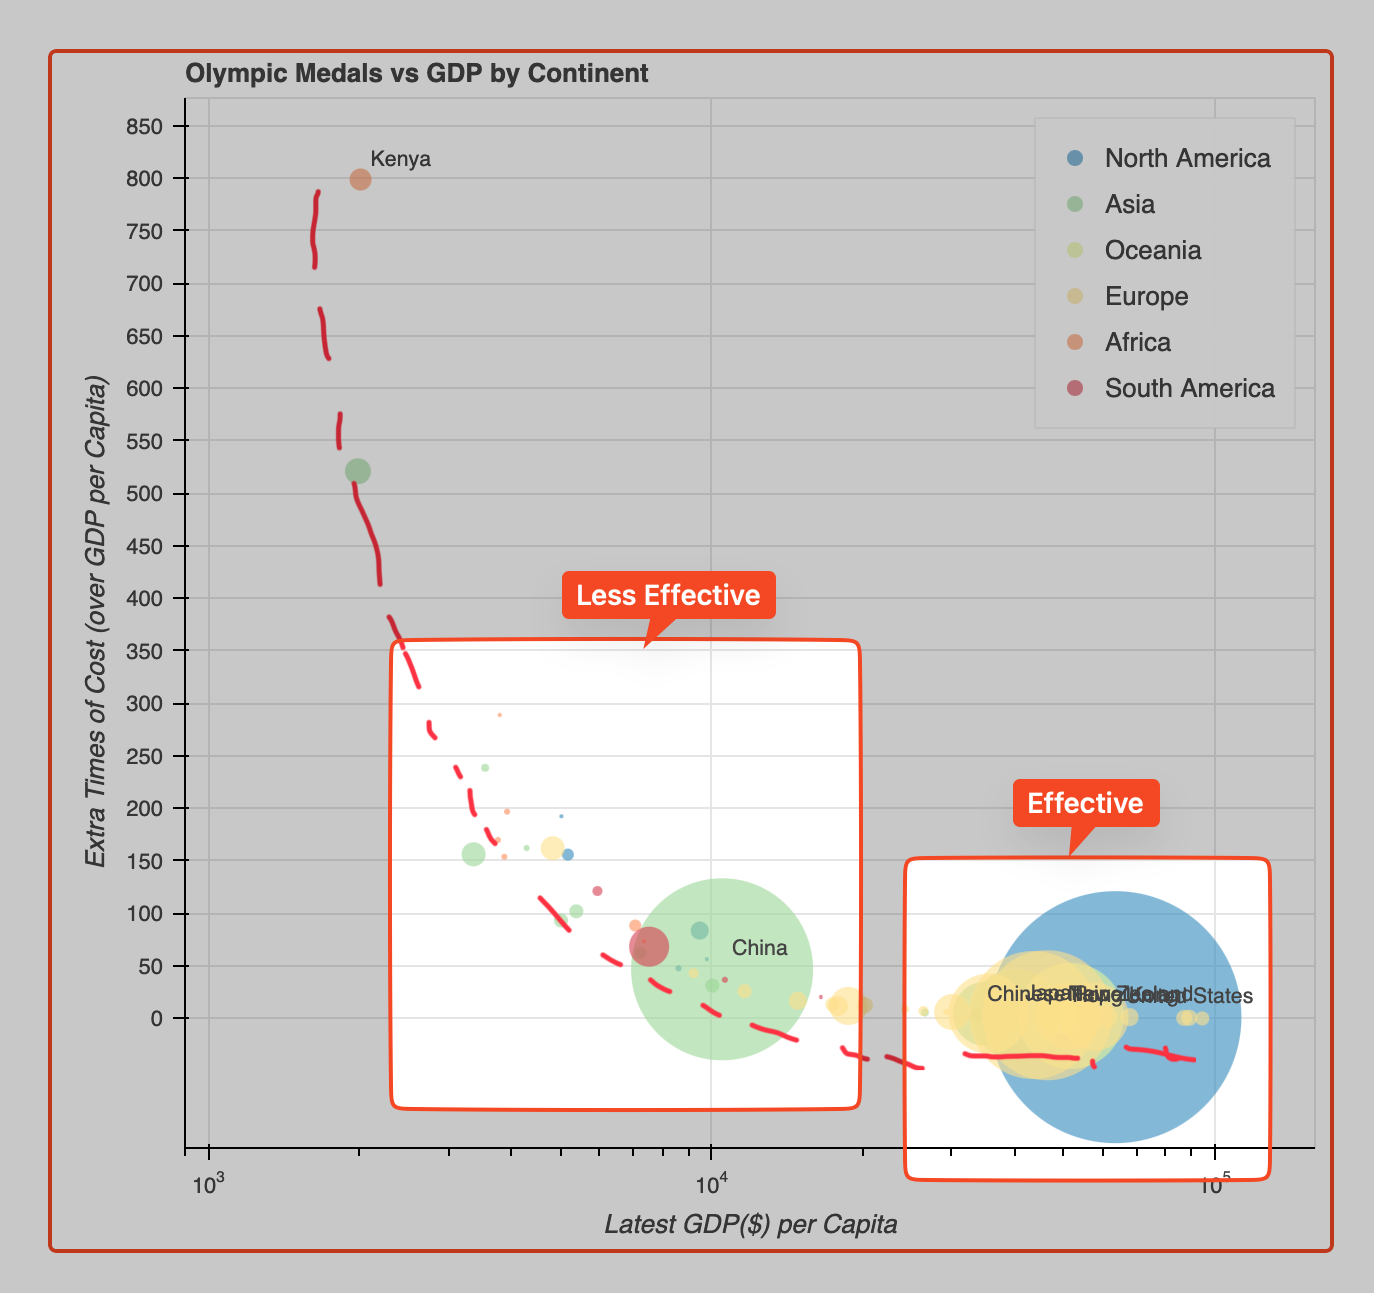
To analyze the effectiveness, we'll look at the balance between GDP per capita, population size, and the cost of winning medals (medal_usd_gpd_population_cost_extra and its percentage). A lower value for these metrics indicates greater effectiveness, as it means less extra cost for individuals to win a medal in their country.

img

Top Performers in Cost-Effectiveness (Lowest extra cost):

  1. United States🇺🇲

GDP per capita: $63,544

Extra cost per medal: $65,456 (1.03% of GDP per capita) The U.S. shows exceptional efficiency in converting its high GDP per capita into Olympic success.

  1. Japan🇯🇵

GDP per capita: $40,193

Extra cost per medal: $162,807 (4.05% of GDP per capita) Japan🇯🇵 achieves a good balance, with a moderate GDP per capita and a relatively low extra cost per medal.

  1. Netherlands🇳🇱

GDP per capita: $57,768

Extra cost per medal: $84,232 (1.46% of GDP per capita) The Netherlands🇳🇱 demonstrates excellent cost-effectiveness, with a high GDP per capita and very low extra cost per medal.

  1. Australia🇦🇺

GDP per capita: $51,812

Extra cost per medal: $110,188 (2.13% of GDP per capita) Australia🇦🇺 shows high efficiency, with a high GDP per capita and a low extra cost per medal.

  1. Great Britain🇬🇧

GDP per capita: $46,510

Extra cost per medal: $132,490 (2.85% of GDP per capita) Great Britain🇬🇧 maintains a strong balance between its economic power and Olympic performance.

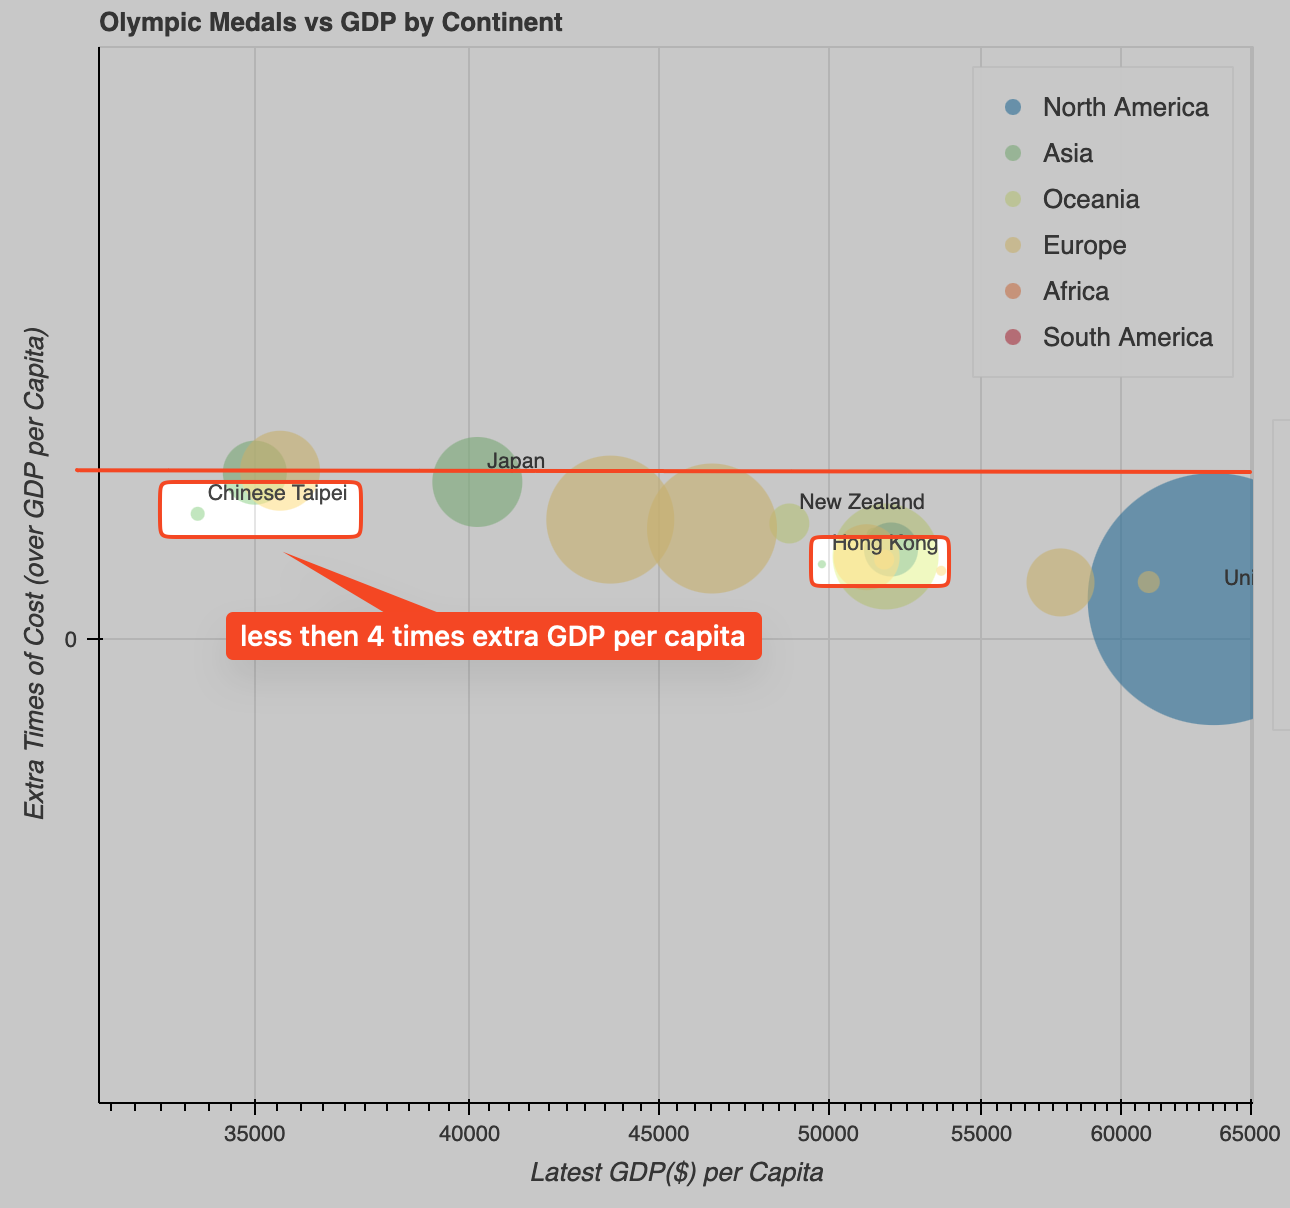
  1. Taiwan🇹🇼, Hong Kong🇭🇰 Are also two effective economies in terms of cost-effectiveness, less than 4 times extra cost per medal compared to GDP per capita.

img

Insights:

  • Economic efficiency: Countries with high GDP per capita and low extra costs per medal (like the U.S. and Netherlands🇳🇱) demonstrate the most efficient conversion of economic resources into Olympic success.

  • Population factor: While not directly visible in these metrics, population size plays a role. Countries with larger populations (like the U.S. and Japan🇯🇵) may have an advantage in talent pool size, contributing to their efficiency.

  • Sports infrastructure: The low extra costs for top performers suggest well-developed sports infrastructures that efficiently nurture talent.

  • Strategic focus: Countries like the Netherlands🇳🇱 and Australia🇦🇺 show that smaller nations can compete effectively with the right focus and efficient sports systems.

  • Diminishing returns: Some countries with very high GDP per capita (e.g., Norway, Ireland) don't top the effectiveness list, suggesting potential diminishing returns on investment in Olympic sports beyond a certain point.

Less Effective Examples:

China🇨🇳

GDP per capita: $10,500

Extra cost per medal: $489,500 (46.62% of GDP per capita) Despite high medal count, the extra cost is significant relative to GDP per capita.

img

Insights

We assume each medal requires the same amount of investment, which may not be the case in reality. The cost of winning a medal in China for an individual is 46 times more than its GDP per capita i.e. $10,500

this somehow explains china's 举国体制 model aka "system concentrating nationwide effort" where the government invests heavily in sports infrastructure and talent development, 1 athlete with almost 50 personnel to support him/her.

Kenya🇰🇪

GDP per capita: $2,007

Extra cost per medal: $1,602,993 (798.79% of GDP per capita) While successful in specific sports, the overall cost relative to GDP is very high.

Ethiopia🇪🇹

GDP per capita: $944

Extra cost per medal: $2,799,056 (2964.44% of GDP per capita) Shows the challenges faced by lower-income countries in achieving broad Olympic success.