Paris 2024 Summer Olympics Medal Analysis
TL;DR
Tips
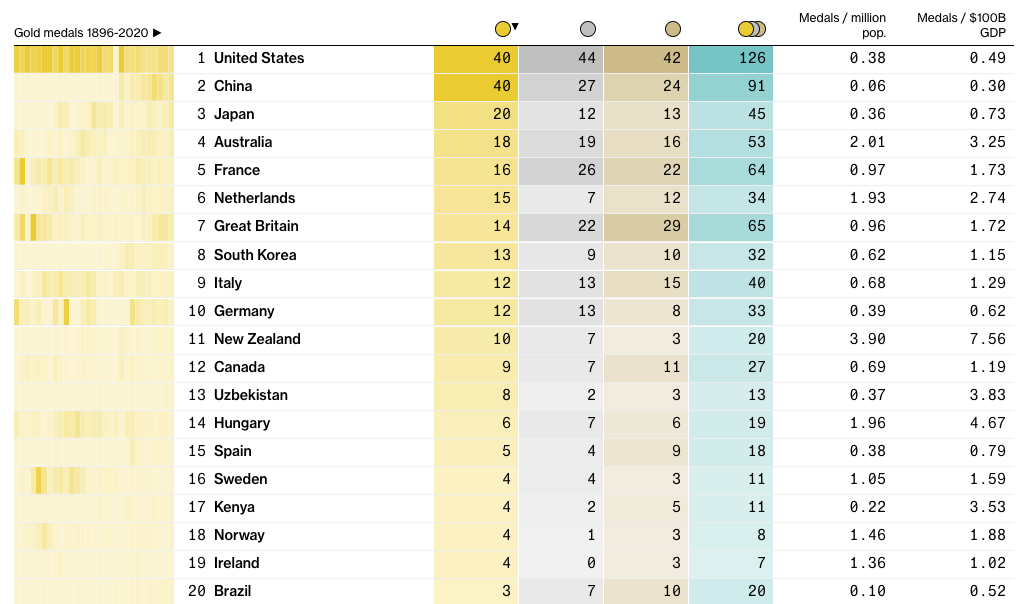
- The United States🇺🇲 is overall the most "effective" or "ROI" country in the 2024 Paris Summer Olympics in terms of GDP per capita invested vs medals won.
- Australia🇦🇺, the Netherlands🇳🇱, and Japan🇯🇵 are also among the top performers in terms of cost-effectiveness. Especially the Australia🇦🇺n, given its population size is almost equal to Texas, USA, it is a Olympic Superpower in terms of cost-effectiveness.
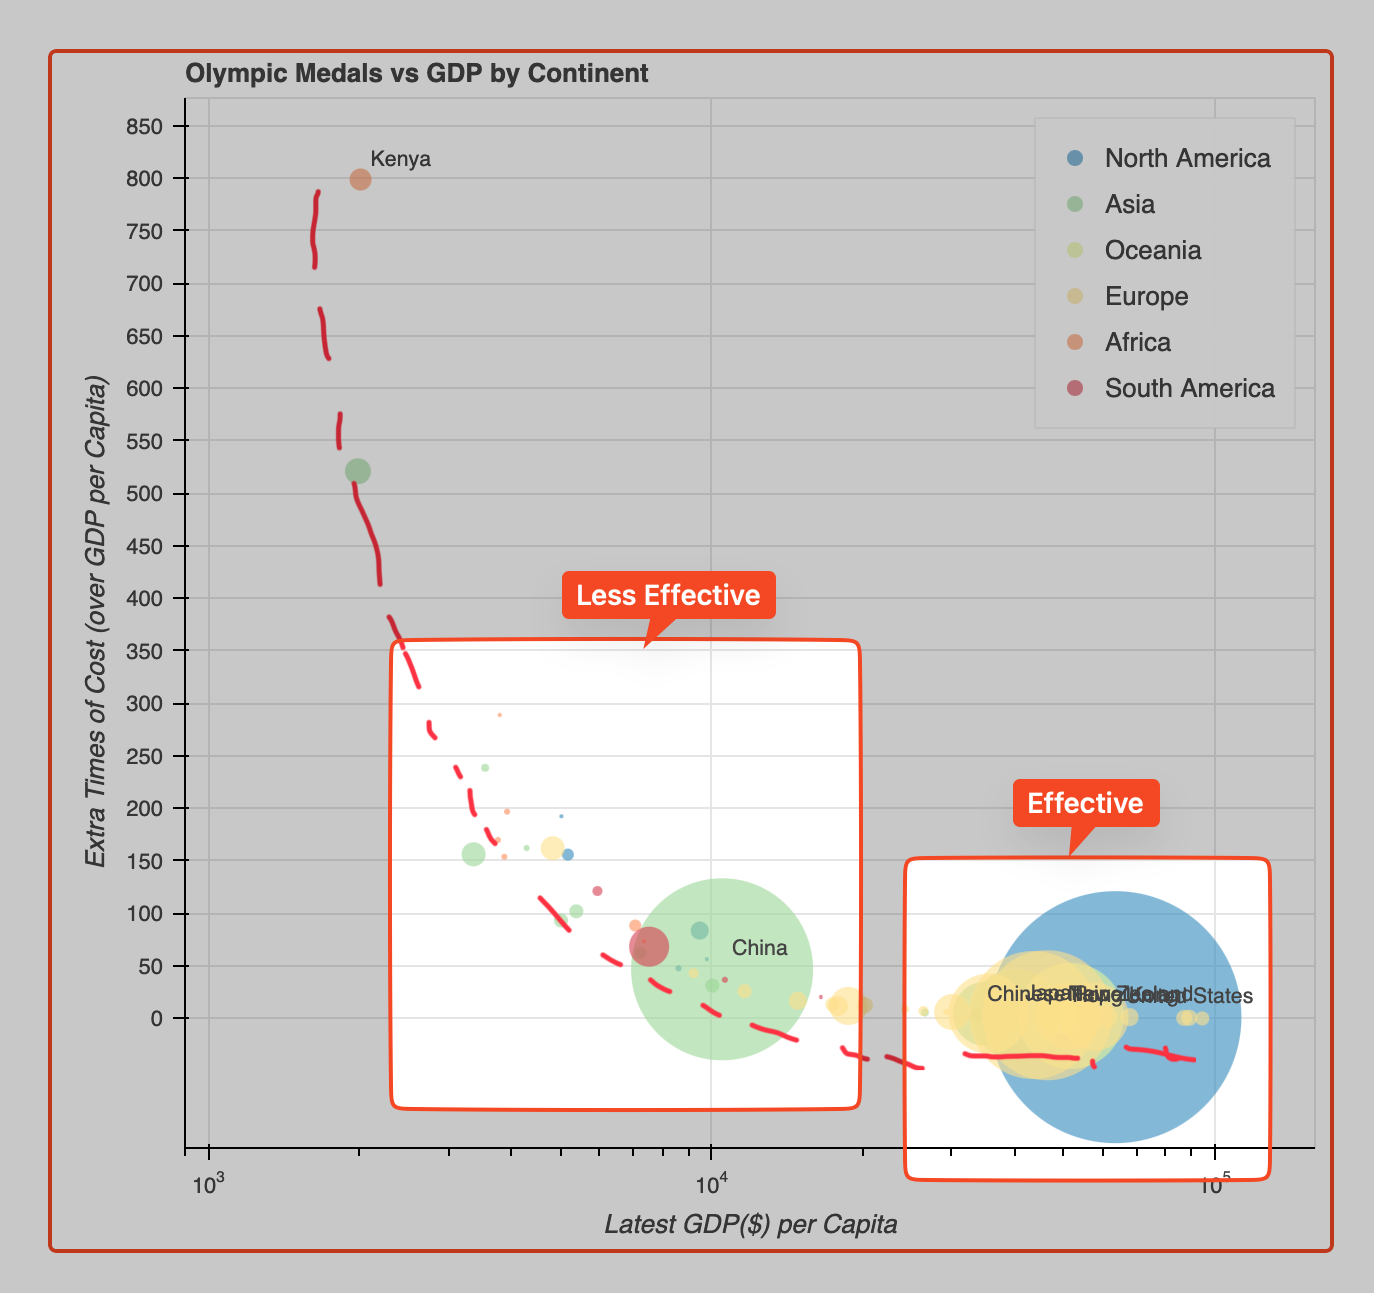
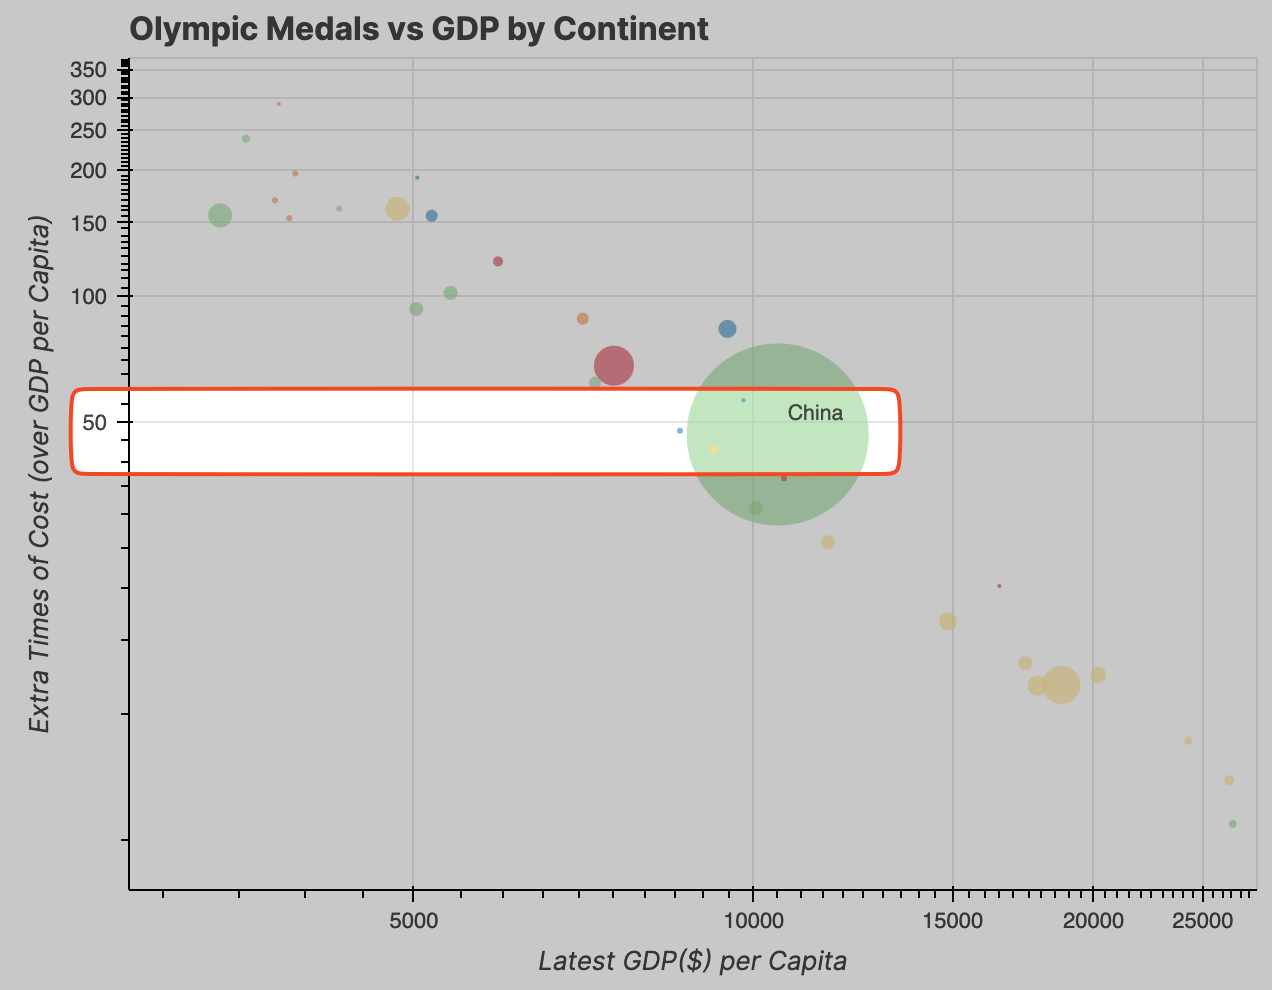
- China🇨🇳, the medal won does not justify the GDP per capita invested in the Olympics, which shows an individual might need to invest 48 times more than the GDP per capita to win a medal in China🇨🇳.
Data Processing
| Column Name | Definition |
|---|---|
| rank_by_gold | Ranking of countries based on the number of gold medals won |
| country | Name of the country |
| gold | Number of gold medals won by the country |
| silver | Number of silver medals won by the country |
| bronze | Number of bronze medals won by the country |
| total_medal | Total number of medals (gold + silver + bronze) won by the country |
| medals_per_million_population | Number of medals won per million population of the country |
| medals_per_usd_100b_gdp | Number of medals won per 100 billion USD of the country's GDP |
| ratio__usd_100b_gdp_vs_million_population | Ratio of medals per 100 billion USD GDP to medals per million population |
| medal_usd_gpd_population_cost | Cost (in USD) associated with winning a medal, factoring in GDP and population |
| continent | The continent to which the country belongs |
| latest_gdp_per_capita_usd | The most recent GDP per capita of the country in USD |
| latest_year_gdp_per_capita_information | The year for which the GDP per capita information is provided |
| source_gdp_info | The source of the GDP information |
| medal_usd_gpd_population_cost_extra | Additional cost (in USD) above the GDP per capita associated with winning a medal |
| medal_usd_gpd_population_cost_extra_percentage | Additional cost as a percentage of GDP per capita associated with winning a medal |
| index | rank_by_gold | country | gold | silver | bronze | total_medal | medals_per_million_population | medals_per_usd_100b_gdp | ratio__usd_100b_gdp_vs_million_population | medal_usd_gpd_population_cost | continent | latest_gdp_per_capita_usd | latest_year_gdp_per_capita_information | source_gdp_info | medal_usd_gpd_population_cost_extra | medal_usd_gpd_population_cost_extra_percentage |
|---|---|---|---|---|---|---|---|---|---|---|---|---|---|---|---|---|
| 0 | 1 | United States | 40 | 44 | 42 | 126 | 0.38 | 0.49 | 1.29 | 129000.0 | North America | 63543.58 | 2021 | World Bank | 65456.42 | 1.03 |
| 1 | 2 | China | 40 | 27 | 24 | 91 | 0.06 | 0.3 | 5.0 | 500000.0 | Asia | 10500.4 | 2020 | IMF | 489499.6 | 46.62 |
| 2 | 3 | Japan | 20 | 12 | 13 | 45 | 0.36 | 0.73 | 2.03 | 203000.0 | Asia | 40193.3 | 2021 | World Bank | 162806.7 | 4.05 |
| 3 | 4 | Australia | 18 | 19 | 16 | 53 | 2.01 | 3.25 | 1.62 | 162000.0 | Oceania | 51812.15 | 2021 | World Bank | 110187.85 | 2.13 |
| 4 | 5 | France | 16 | 26 | 22 | 64 | 0.97 | 1.73 | 1.78 | 178000.0 | Europe | 43658.98 | 2021 | World Bank | 134341.02 | 3.08 |
Plotting the Data
1. Overall Medal Distribution Among Countries
The distribution of Olympic medals among countries shows significant disparities:
- Top performers: The United States🇺🇲 (126 medals), China🇨🇳 (91 medals), and Japan🇯🇵 (45 medals) lead in total medal count. These countries not only have large economies but also invest heavily in sports infrastructure.
- Mid-range performers: Countries like Australia🇦🇺 (53 medals), France (64 medals), and Great Britain🇬🇧 (65 medals) perform well despite smaller populations, indicating efficient sports systems.
- Emerging powers: Countries like the Netherlands🇳🇱 (34 medals) and New Zealand (20 medals) show strong performance relative to their population size. Concentration of medals: The top 10 countries account for approximately 60% of all medals, indicating a high concentration of Olympic success among a few nations.
2. Insights Related to Latest GDP per Capita
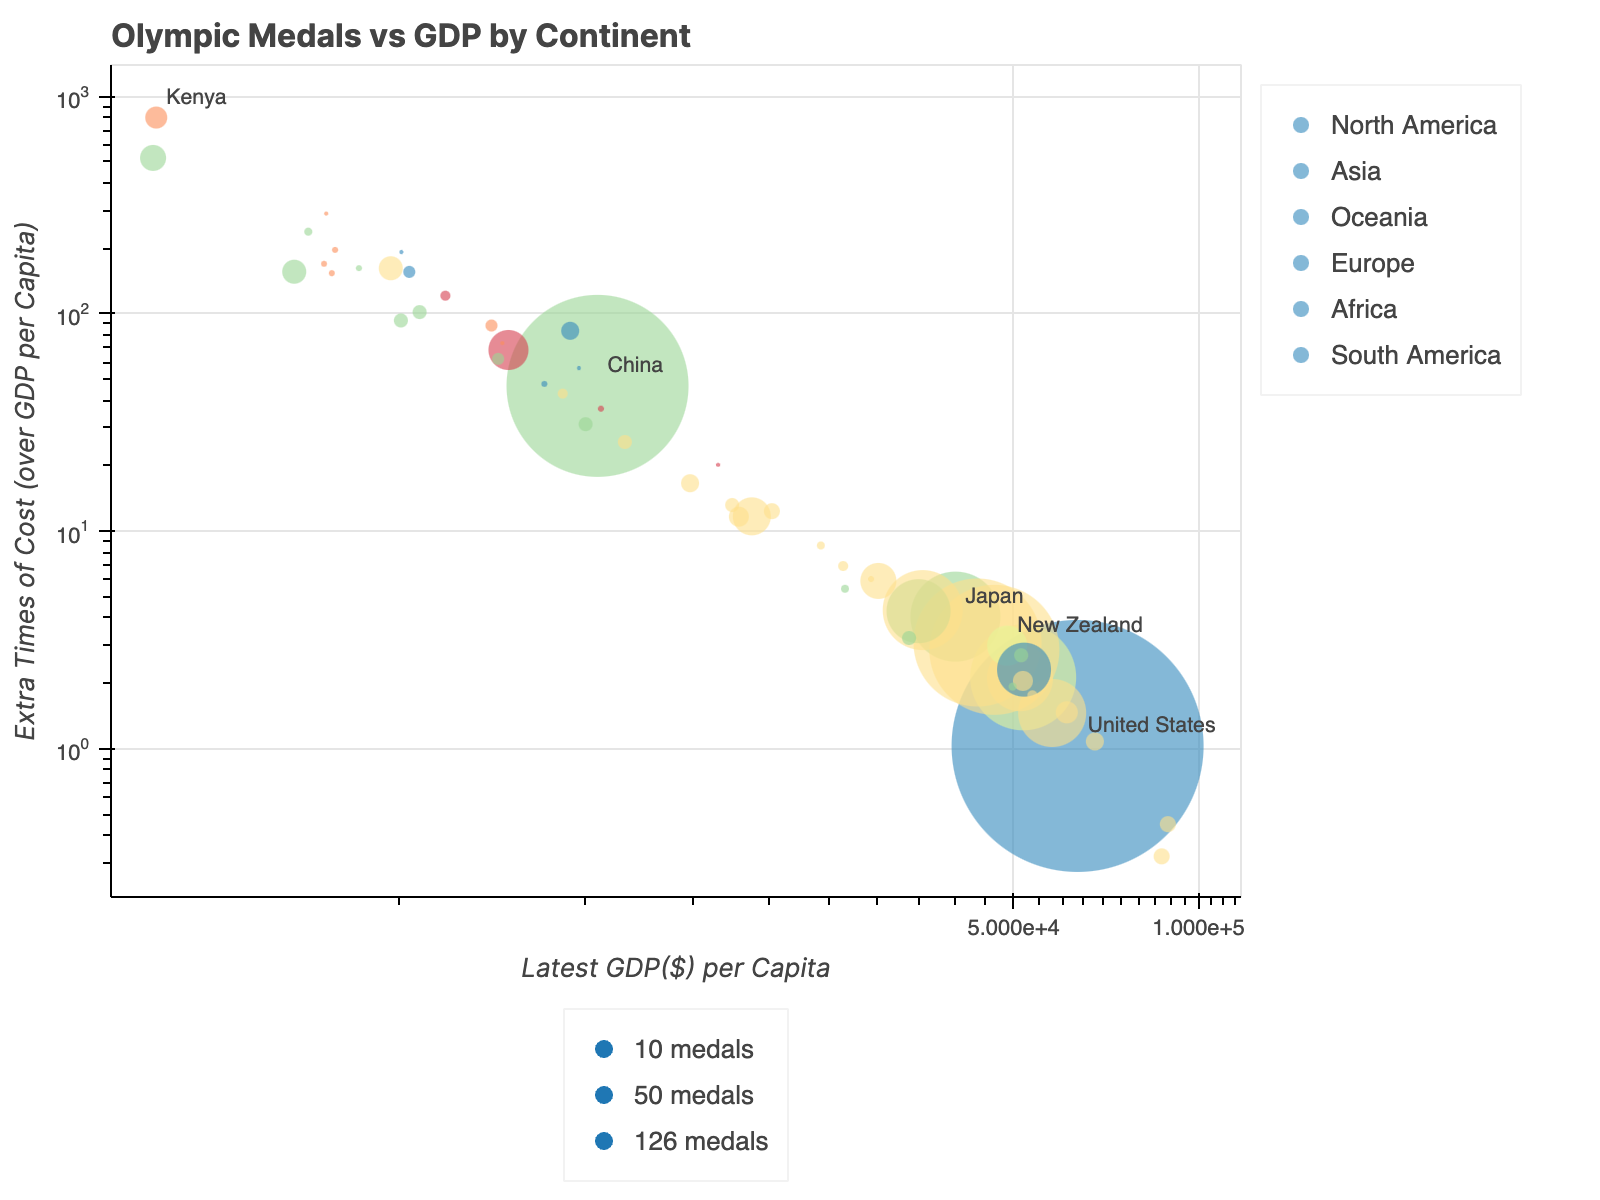
There's a clear, but not perfect, correlation between GDP per capita and Olympic performance:
- High GDP, high performance: Countries with high GDP per capita, such as the United States🇺🇲 (
$63,544), Australia🇦🇺 ($51,812), and the Netherlands🇳🇱 ($57,768), tend to perform well in the Olympics. - Exceptions to the rule: Some countries with relatively lower GDP per capita, like China🇨🇳 (
$10,500) and Japan🇯🇵 ($40,193), still perform exceptionally well, suggesting factors beyond economic power at play. - Diminishing returns: Very high GDP per capita doesn't guarantee proportionally higher medal counts. For example, Ireland (
$94,556) and Norway ($89,154) have fewer medals than countries with lower GDP per capita. - Emerging economies: Some countries with lower GDP per capita, like Kenya (
$2,007) and Ethiopia ($944), perform well in specific sports, showing specialization can overcome economic disadvantages.
3. Effectiveness Analysis: GDP per Capita vs Medal Costs
To analyze the effectiveness, we'll look at the balance between GDP per capita, population size, and the cost of winning medals (medal_usd_gpd_population_cost_extra and its percentage). A lower value for these metrics indicates greater effectiveness, as it means less extra cost for individuals to win a medal in their country.
Top Performers in Cost-Effectiveness (Lowest extra cost):
- United States🇺🇲
GDP per capita: $63,544
Extra cost per medal: $65,456 (1.03% of GDP per capita)
The U.S. shows exceptional efficiency in converting its high GDP per capita into Olympic success.
- Japan🇯🇵
GDP per capita: $40,193
Extra cost per medal: $162,807 (4.05% of GDP per capita)
Japan🇯🇵 achieves a good balance, with a moderate GDP per capita and a relatively low extra cost per medal.
- Netherlands🇳🇱
GDP per capita: $57,768
Extra cost per medal: $84,232 (1.46% of GDP per capita)
The Netherlands🇳🇱 demonstrates excellent cost-effectiveness, with a high GDP per capita and very low extra cost per medal.
- Australia🇦🇺
GDP per capita: $51,812
Extra cost per medal: $110,188 (2.13% of GDP per capita)
Australia🇦🇺 shows high efficiency, with a high GDP per capita and a low extra cost per medal.
- Great Britain🇬🇧
GDP per capita: $46,510
Extra cost per medal: $132,490 (2.85% of GDP per capita)
Great Britain🇬🇧 maintains a strong balance between its economic power and Olympic performance.
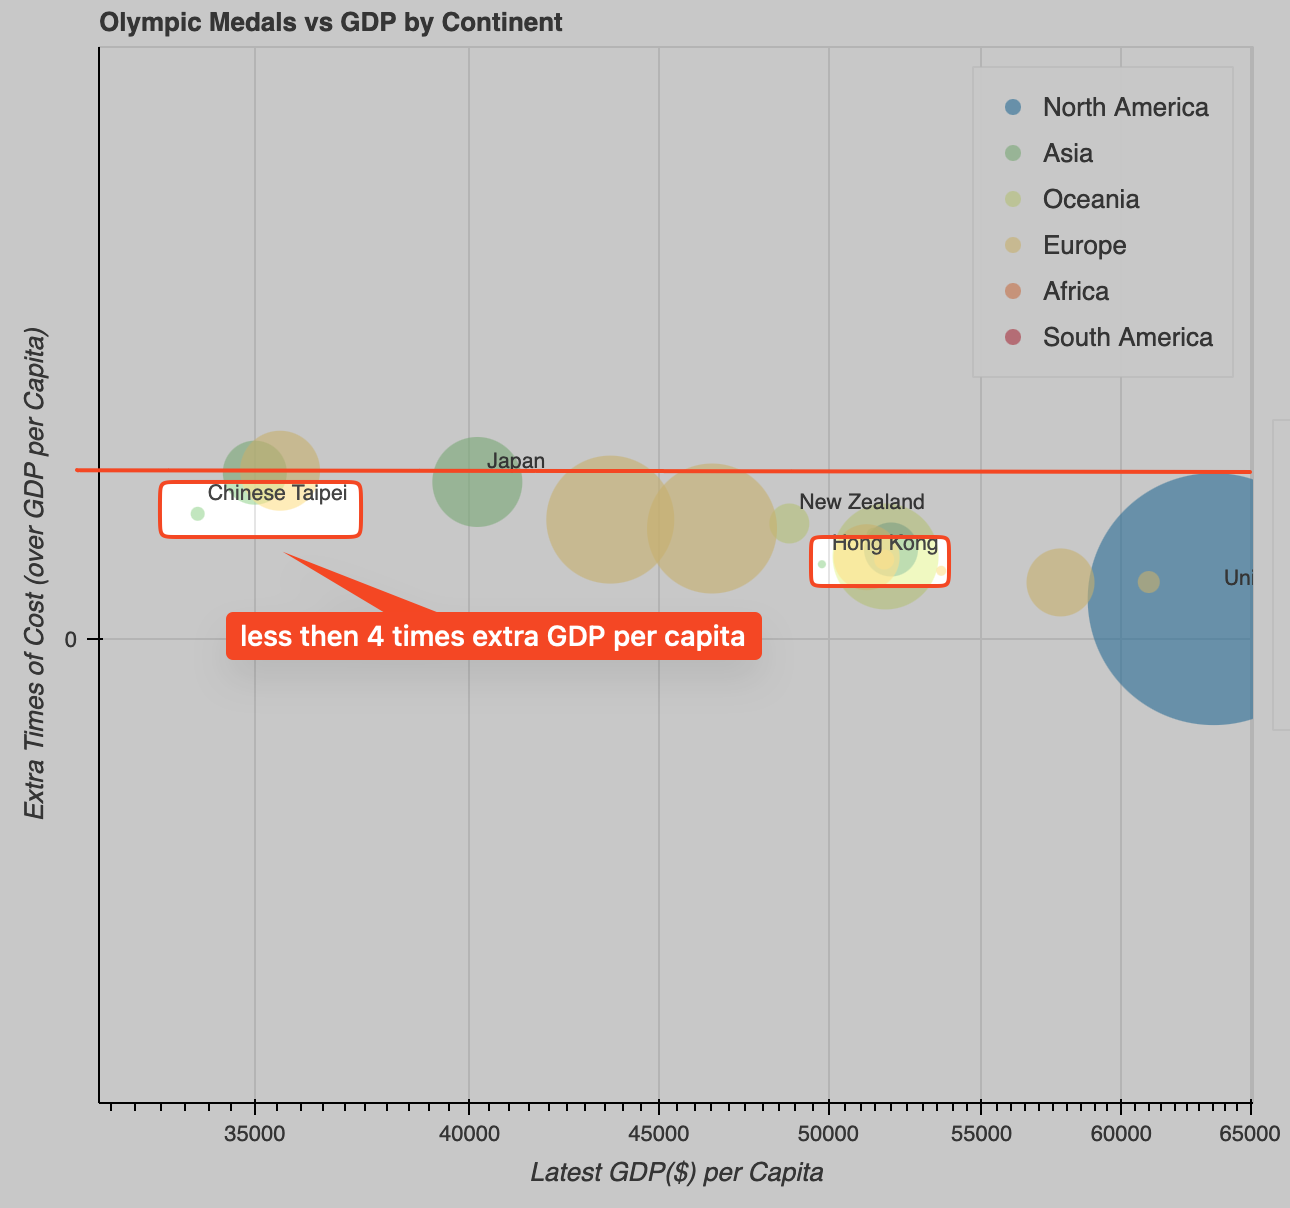
- Taiwan🇹🇼, Hong Kong🇭🇰 Are also two effective economies in terms of cost-effectiveness, less than 4 times extra cost per medal compared to GDP per capita.
Insights:
-
Economic efficiency: Countries with high GDP per capita and low extra costs per medal (like the U.S. and Netherlands🇳🇱) demonstrate the most efficient conversion of economic resources into Olympic success.
-
Population factor: While not directly visible in these metrics, population size plays a role. Countries with larger populations (like the U.S. and Japan🇯🇵) may have an advantage in talent pool size, contributing to their efficiency.
-
Sports infrastructure: The low extra costs for top performers suggest well-developed sports infrastructures that efficiently nurture talent.
-
Strategic focus: Countries like the Netherlands🇳🇱 and Australia🇦🇺 show that smaller nations can compete effectively with the right focus and efficient sports systems.
-
Diminishing returns: Some countries with very high GDP per capita (e.g., Norway, Ireland) don't top the effectiveness list, suggesting potential diminishing returns on investment in Olympic sports beyond a certain point.
Less Effective Examples:
China🇨🇳
GDP per capita: $10,500
Extra cost per medal: $489,500 (46.62% of GDP per capita)
Despite high medal count, the extra cost is significant relative to GDP per capita.
Insights
We assume each medal requires the same amount of investment, which may not be the case in reality. The cost of winning a medal in China for an individual is 46 times more than its GDP per capita i.e. $10,500
this somehow explains china's 举国体制 model aka "system concentrating nationwide effort" where the government invests heavily in sports infrastructure and talent development, 1 athlete with almost 50 personnel to support him/her.
Kenya🇰🇪
GDP per capita: $2,007
Extra cost per medal: $1,602,993 (798.79% of GDP per capita)
While successful in specific sports, the overall cost relative to GDP is very high.
Ethiopia🇪🇹
GDP per capita: $944
Extra cost per medal: $2,799,056 (2964.44% of GDP per capita)
Shows the challenges faced by lower-income countries in achieving broad Olympic success.